
Being able to monitor how much power a server is utilizing over a period of time can be extremely handy. In this post I will show how I handled this using Grafana for graphing, Telegraf for gathering data from the iDRAC6 (over IPMI), and InlufxDB for storage.
This post assumes you already have Telegraf, InfluxDB, and Grafana all installed and configured to work with each other already. You also need a PowerEdge server that exposes power information over IPMI via the iDRAC. I am using the PowerEdge r710 that comes with iDRAC6.
Getting Started
Configuring iDRAC on your server
The iDRAC (short for Integrated Dell Remote Access Controller) is a small add-on card that sits on the server motherboard that allows Systems Administrators to update and manage Dell systems, even when the server is turned off.
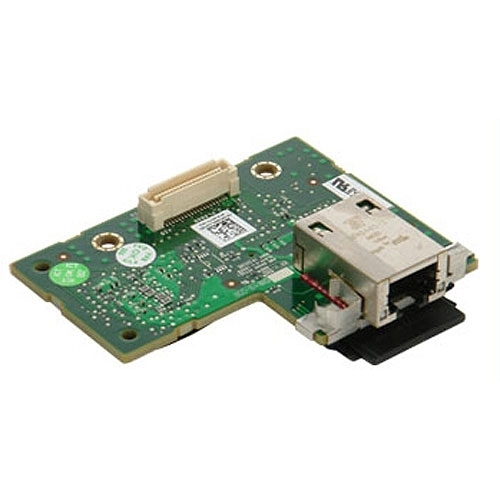
So in order for this to work make sure your server actually has one of these cards installed. When they are installed they add an additional Ethernet port to the back of the system that needs to be plugged into your network in order for you to be able to communicate with it (so you can check your system has this additional port to see if the card is installed).
You will need to go through the boot menu and press CTRL+E to configure the iDRAC. Once in the Configuration Utility setup these things:
- IPMI Over Lan: TRUE (We will use IPMI to have Telegraf poll for data so this has to be enabled)
- NIC Selection: This depends on how you want it setup.. See this help article from dell for more information on the options.
- LAN Parameters: Setup your static IP under this
- LAN User Configuration: Set a username and password
Once all of that is configured you should be able to access the iDRAC web UI from a system on the same network to confirm its working:
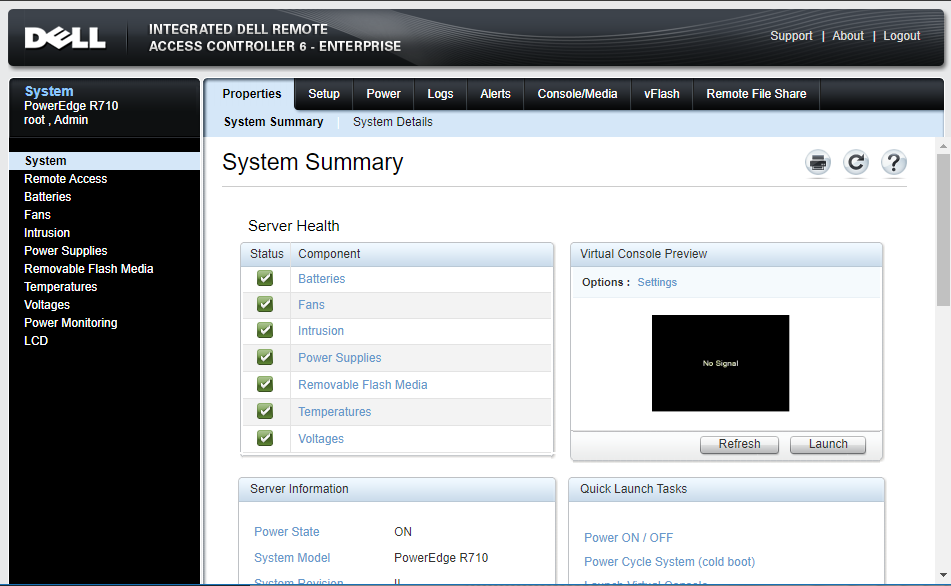
If you are able to login things should be good on this step.
Configuring Telegraf
I assume you already have Telegraf installed and configured to output to InfluxDB. Open up your telegraf.conf file and configure the [[inputs.ipmi_sensor]] sensor like so:
# # Read metrics from the bare metal servers via IPMI
 [[inputs.ipmi_sensor]]
   ## optionally specify the path to the ipmitool executable
   # path = "/usr/bin/ipmitool"
   ##
   ## optionally force session privilege level. Can be CALLBACK, USER, OPERATOR, ADMINISTRATOR
   # privilege = "ADMINISTRATOR"
   ##
   ## optionally specify one or more servers via a url matching
   ##  [username[:password]@][protocol[(address)]]
   ##  e.g.
   ##    root:passwd@lan(127.0.0.1)
   ##
   ## if no servers are specified, local machine sensor stats will be queried
   ##
   servers = ["username:password@lanplus(192.168.1.11)"]

   ## Recommended: use metric 'interval' that is a multiple of 'timeout' to avoid
   ## gaps or overlap in pulled data
   interval = "30s"

   ## Timeout for the ipmitool command to complete
   timeout = "20s"
Make sure to replace username, password, and the example ip address 192.168.1.11 with your details.
Now restart Telegraf and check its log file to make sure it's working correctly. If you don't see any errors after about a minute you should be all good here.
Setting up our graphs in Grafana
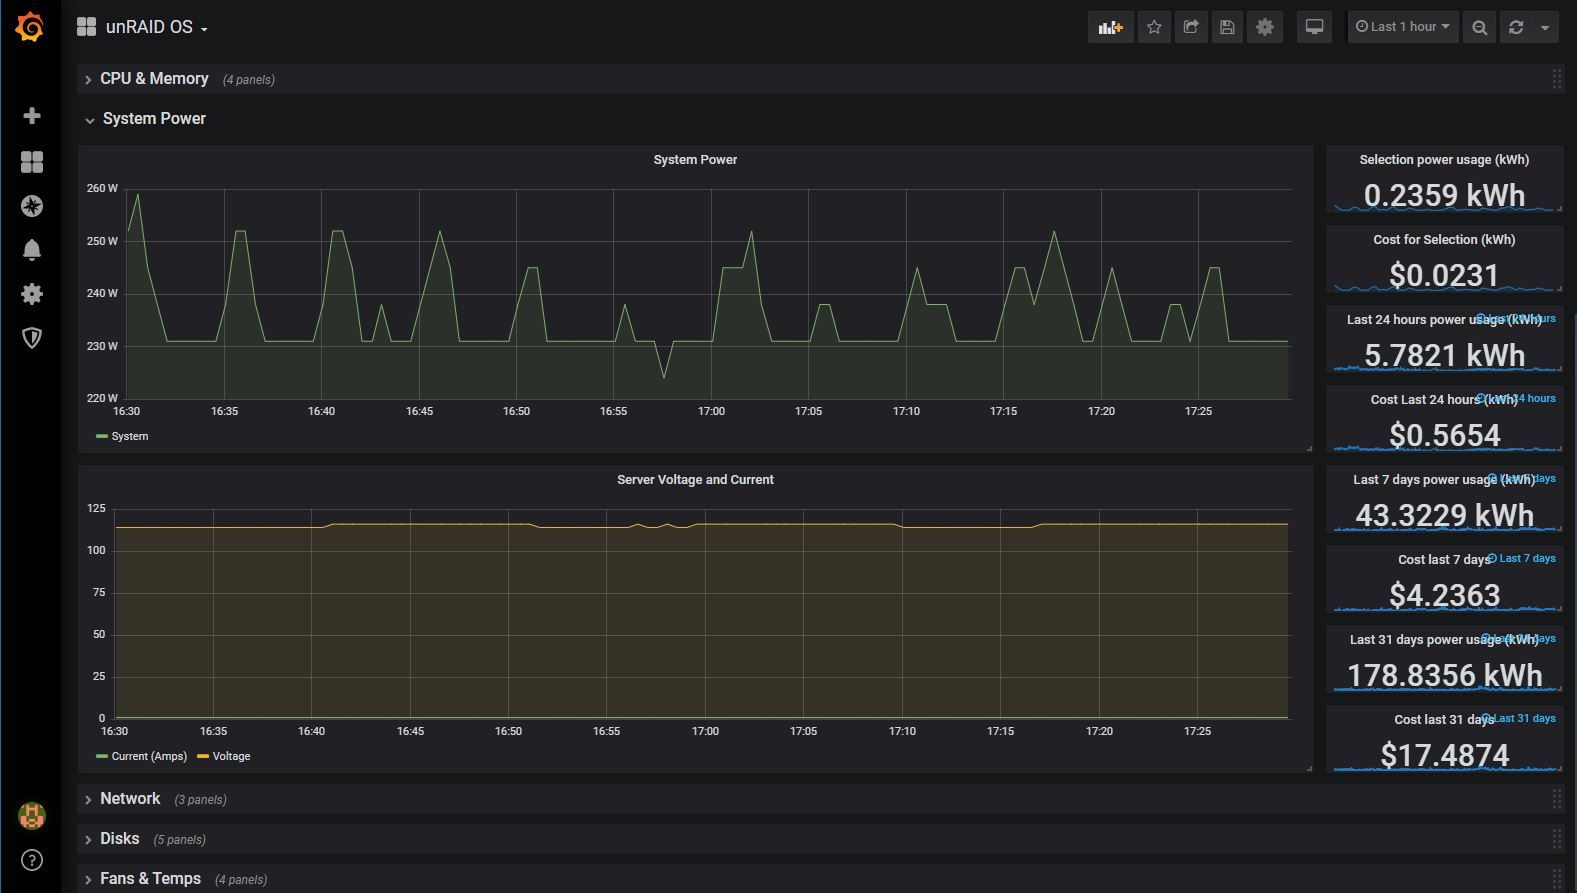
Using Grafana you can build some pretty awesome analytic dashboards. Here is the power section of my server dashboard exported so I can share it with all of you:
Here is the link to the dashboard I posted on Grafana's website:
And here is a copy of the JSON on GitHub for archival reasons:

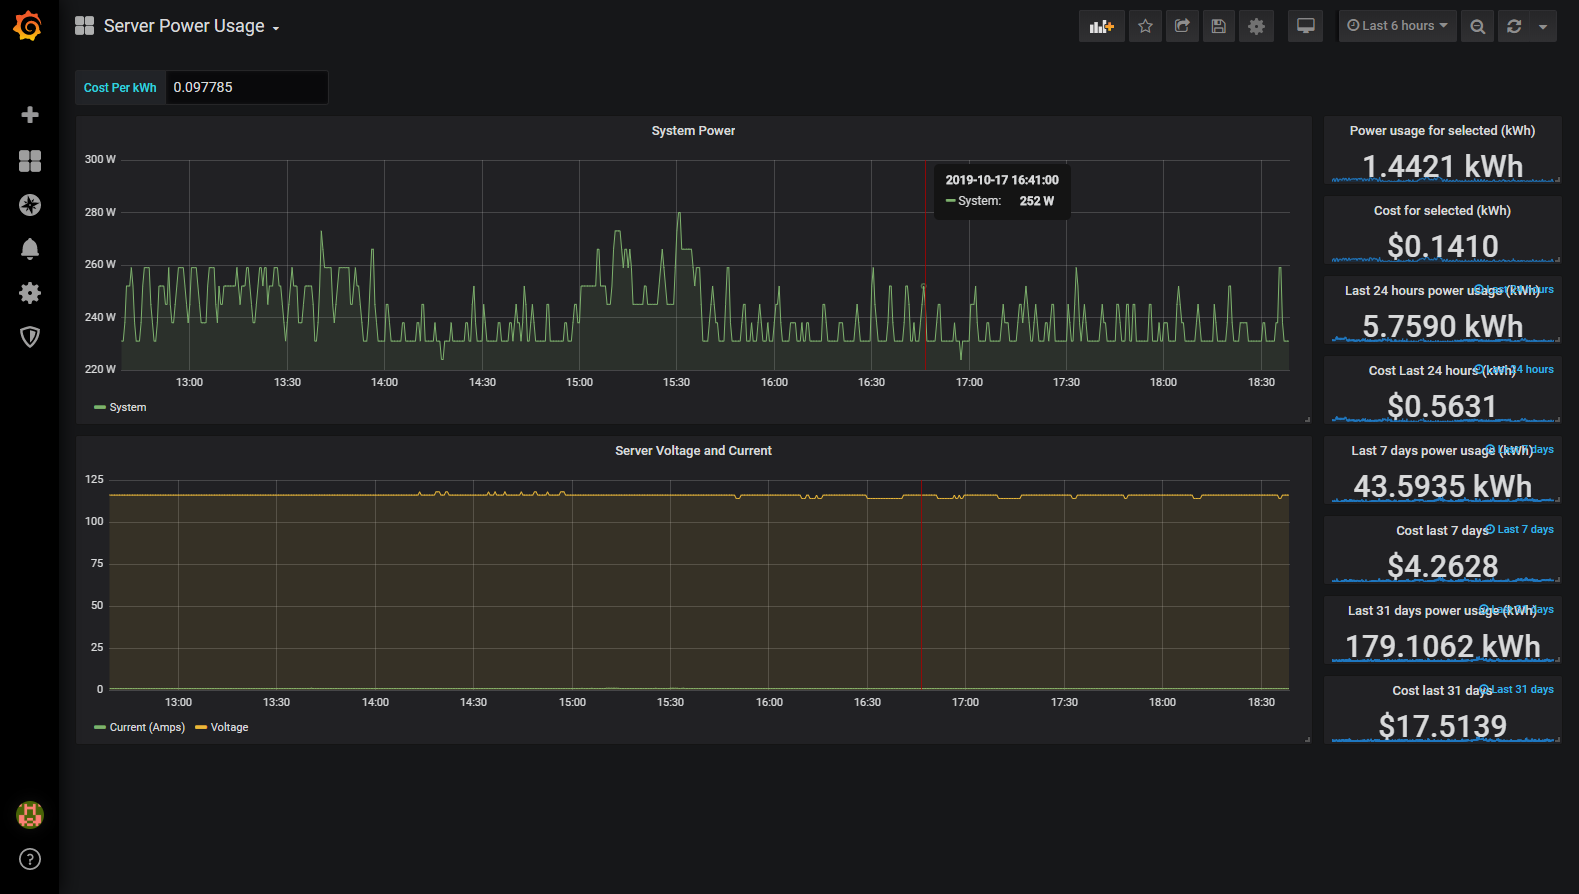
I made the Cost Per kWh as an input because that usually changing all the time. You will need to make sure to enter your own costs here (just get them from your last electric bill).
Conclusion
I'm really glad I was able to make this happen. If you end up adding your CPU, Memory, and disk stats to the dashboard you will be able to see how they all relate over time. I also really like that I can select any period of time (say the last hour) and it will tell me how much power was used and what the cost was ($0.02 right now).
I've been using this for almost a year now without any issues. I can tell you exactly what my power consumption has been for any period during that time. Pretty nifty ;)
If you have any feedback or need help with any of this feel free to leave a comment below and I will get back to you.